Single HTML files.
No Experience Builder. No Dashboards. No Instant Apps. No React. No npm. No build step.
Each demo showcases a specific SDK capability — AI integration, client-side data joins, live feature queries — that no standard Esri tool can do. Powered by the ArcGIS JavaScript SDK and Claude. Built faster than configuring the tools they replace.
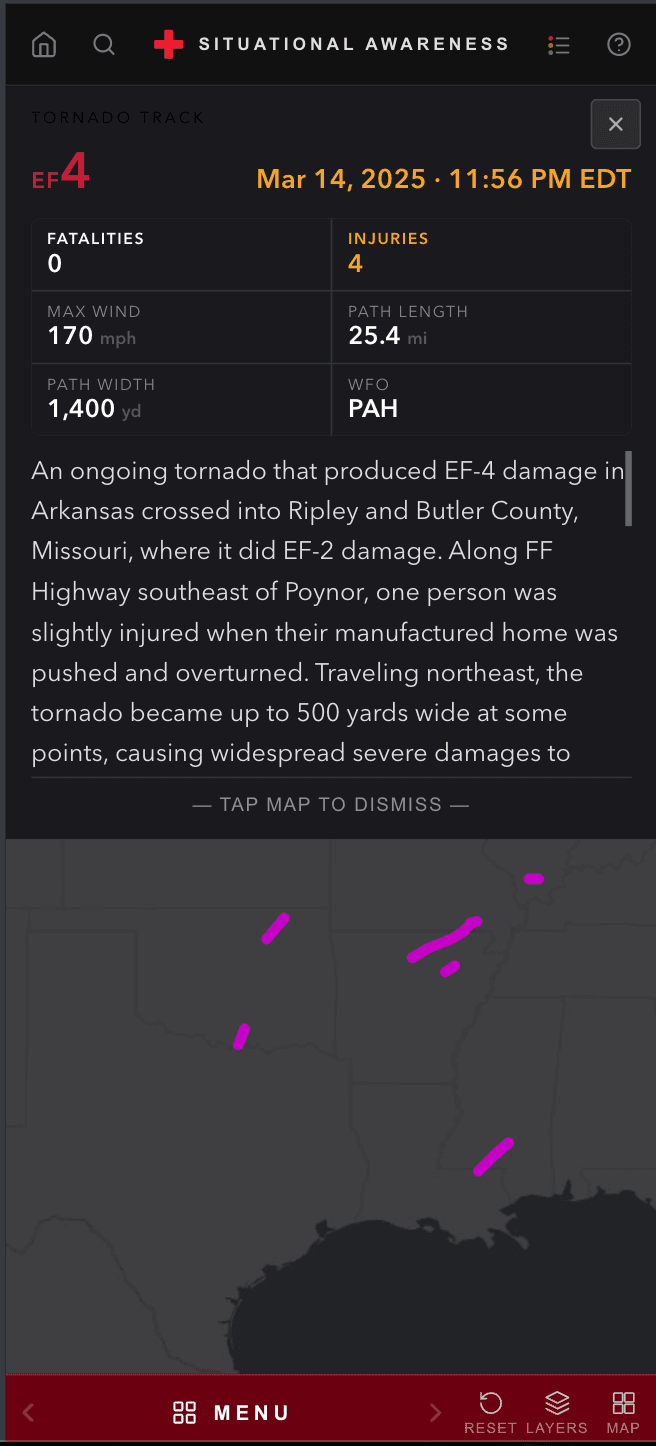
Situational Awareness — Mobile Hazard Map
A full-screen dark-themed mobile map with 18 live data layers across two thumb-optimized grid pages. Wildfires, tornado tracks, NWS alerts, NEXRAD radar, SPC outlooks, drought, stream gauges, storm reports, and Red Cross organizational boundaries — all in a single static HTML file. Tap a tornado track and get fatalities, injuries, path dimensions, and the full NWS narrative. Filter by hazard type, flood stage, wind speed. No framework, no build step, no backend.
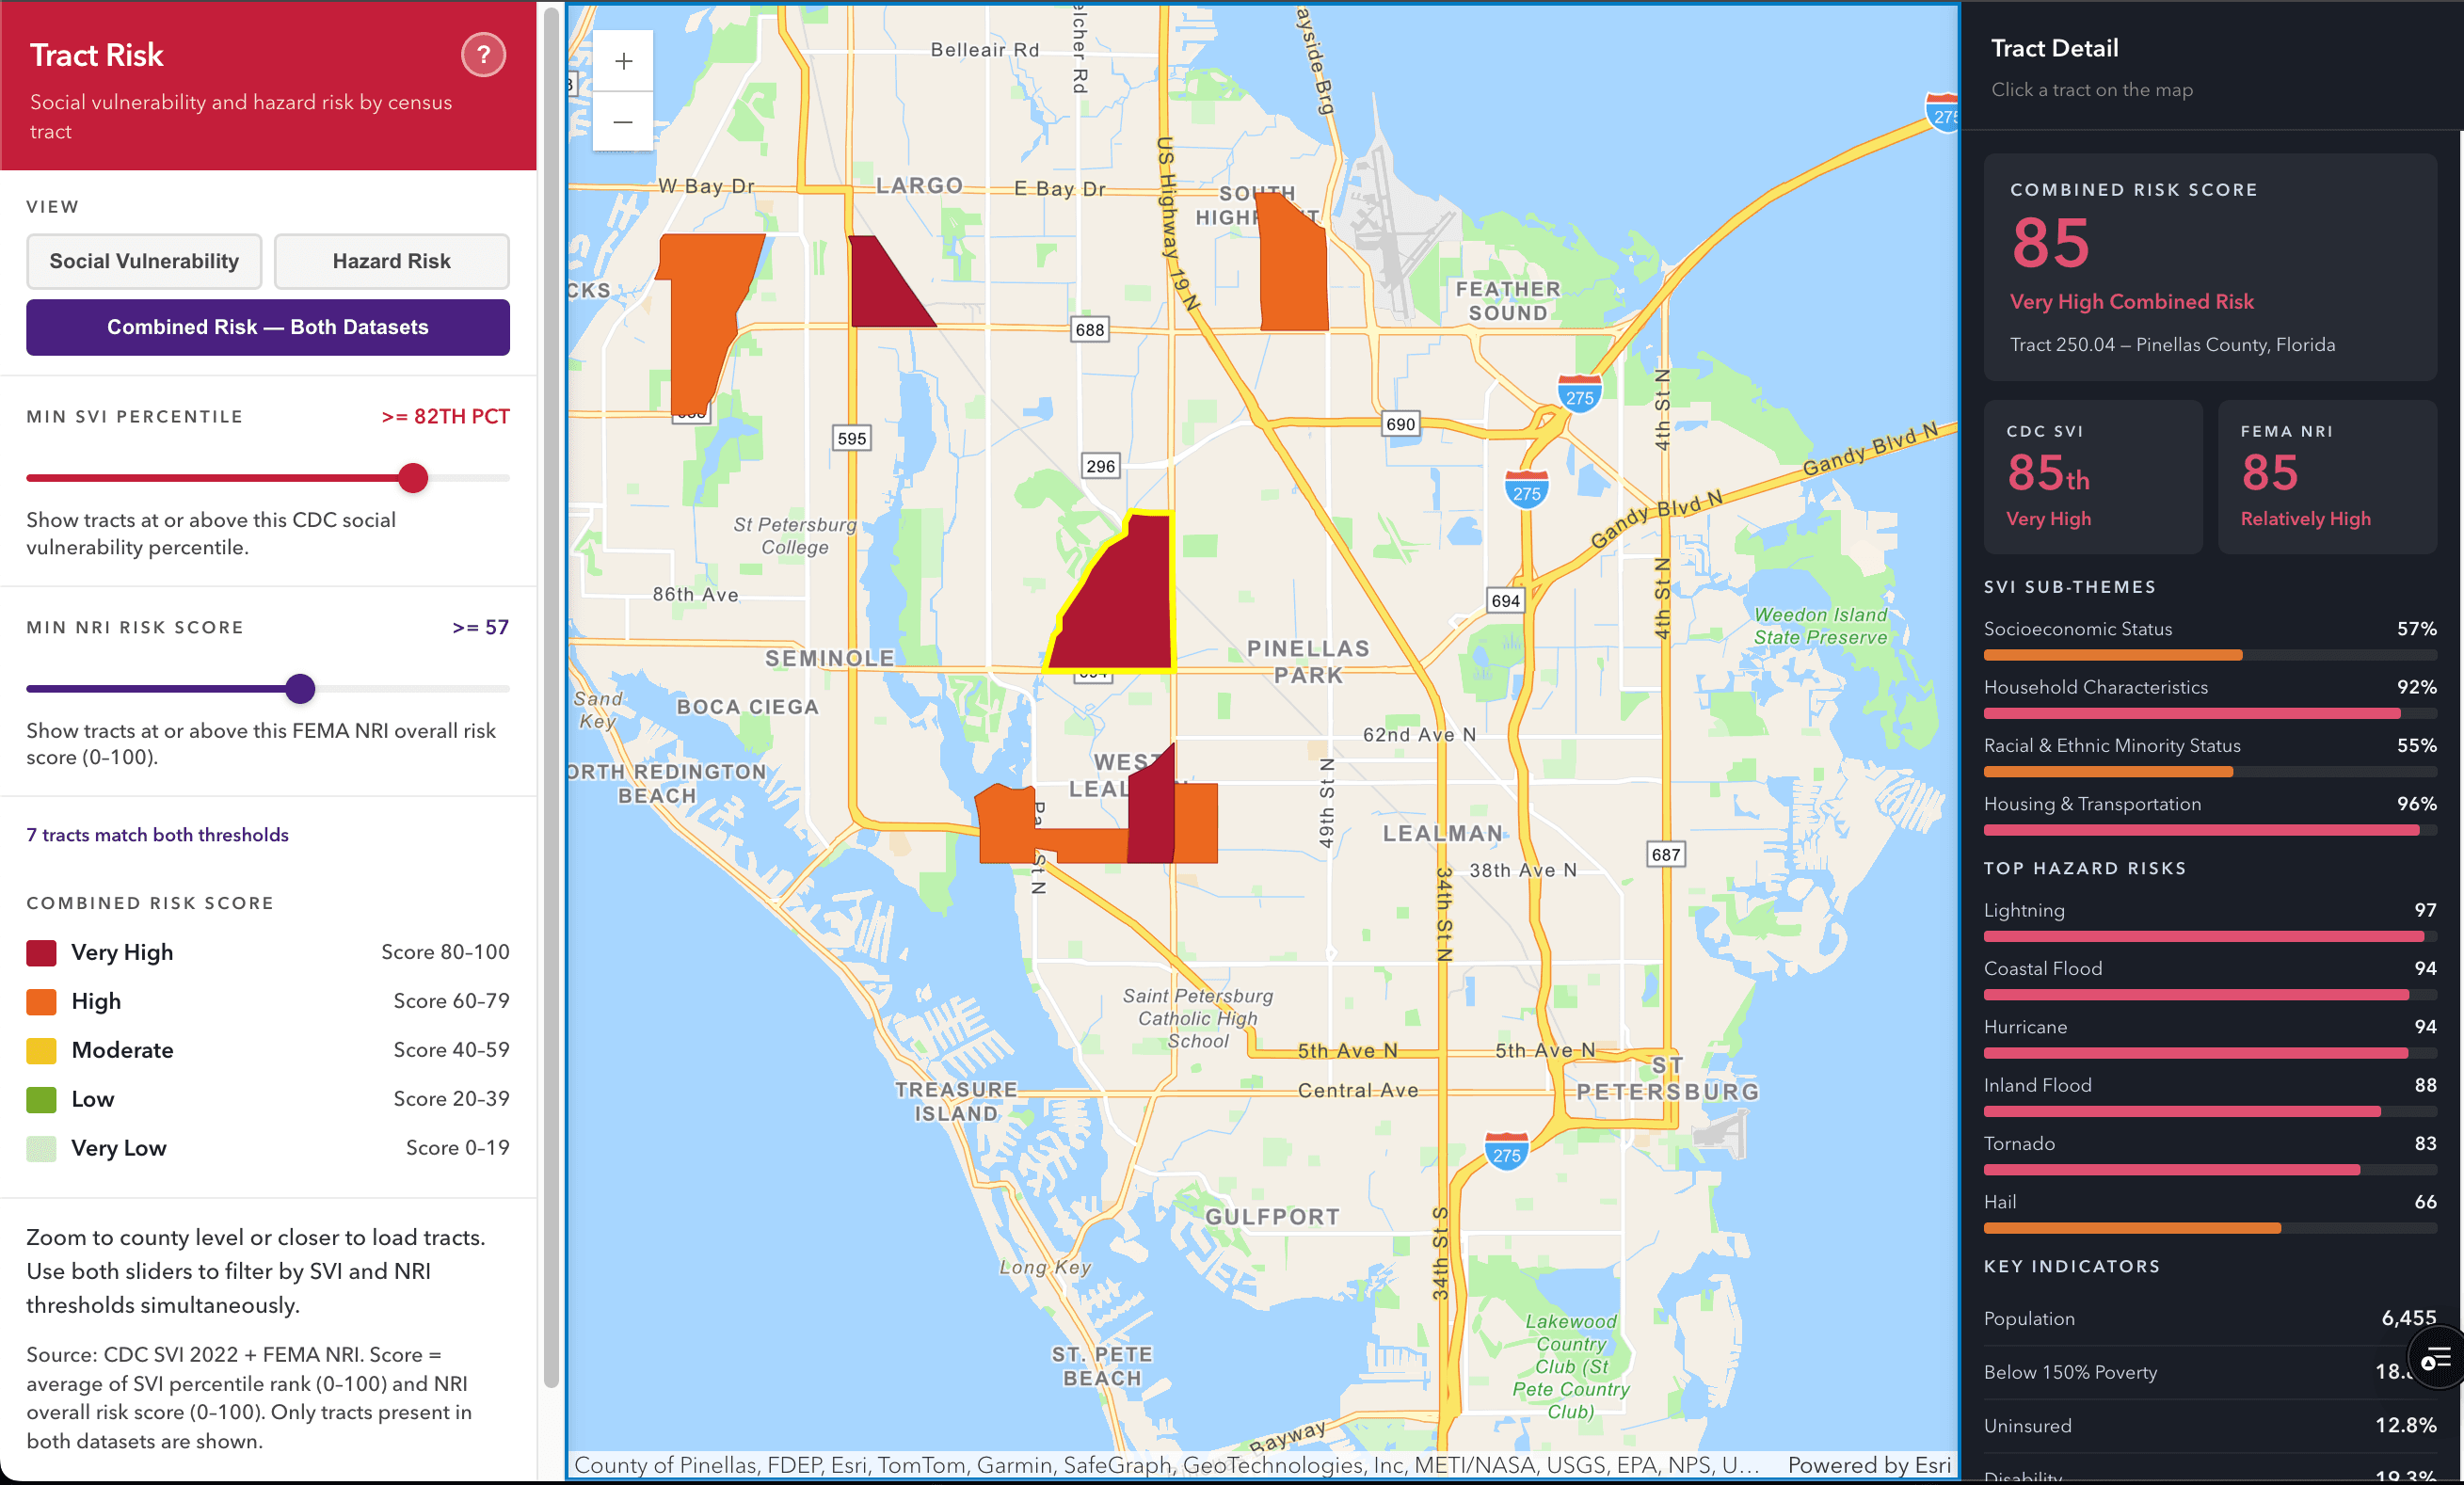
Census Tract Risk Profile — Combined SVI + NRI
Zoom to any county and see every census tract scored by combined social vulnerability and natural hazard risk. CDC SVI and FEMA NRI joined client-side with dual sliders to filter thresholds simultaneously. Click a tract to see the full breakdown: SVI sub-themes, top hazard risks with bar charts, and key population indicators. The kind of pre-disaster intelligence briefing that normally takes a GIS analyst a full day to build.
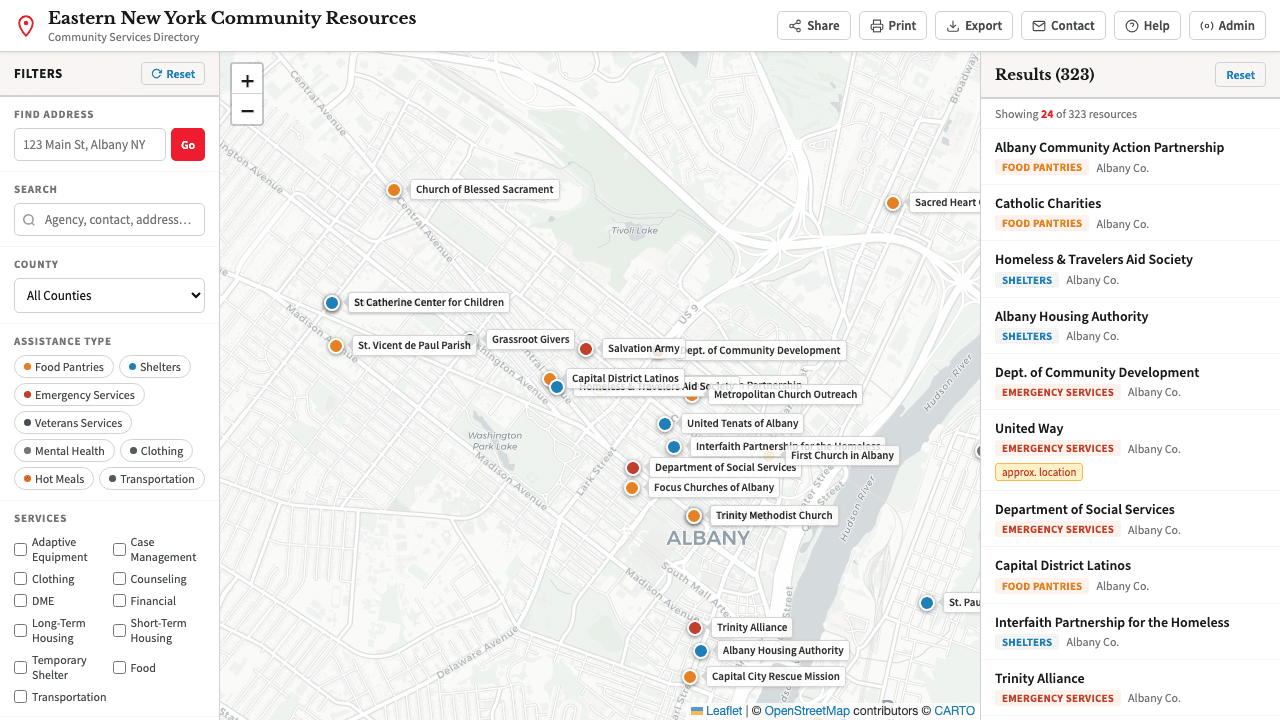
Community Resource Finder — Not an SDK Demo
This one is Leaflet, not the ArcGIS JavaScript SDK — included because it demonstrates what a well-built static HTML tool looks like in practice. A field-deployable resource directory for Eastern New York: 323 food pantries, shelters, and emergency services. Full filter system, mobile bottom-sheet layout, share-by-URL, print mode. No backend, no framework, no database. It also happens to be the only demo on this page with a full mobile layout.
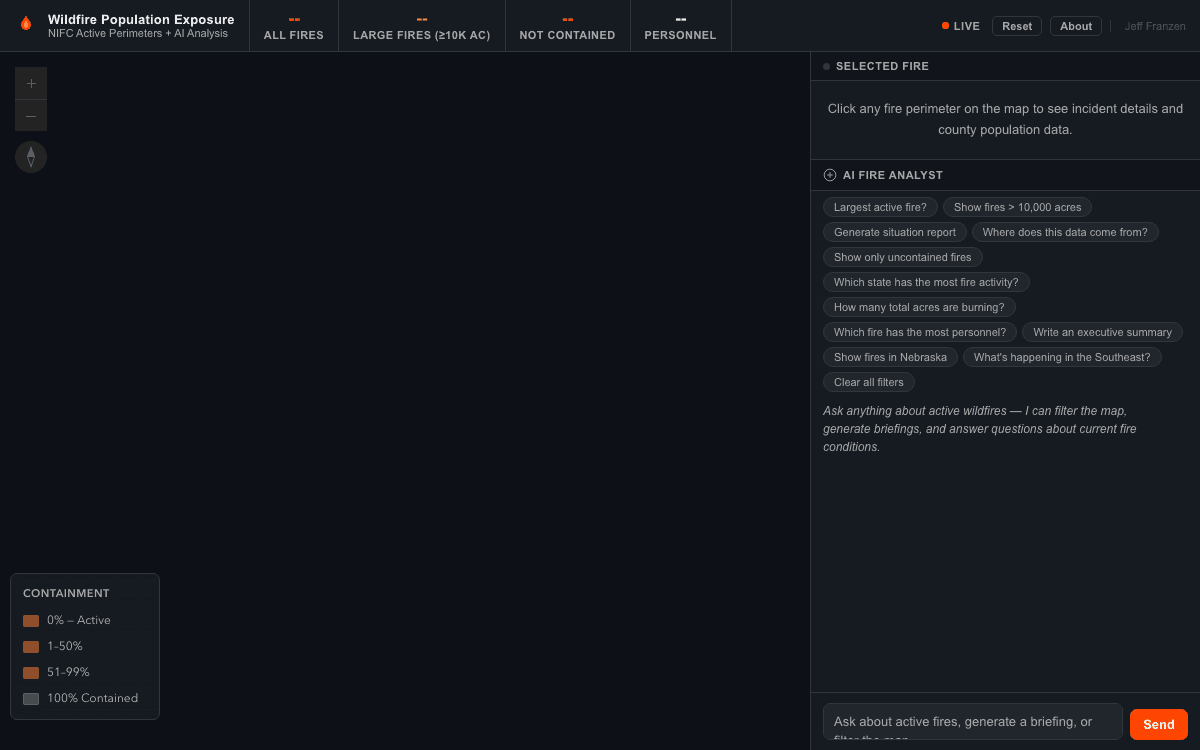
Wildfire Population Exposure — Live NIFC Data + AI
Every active fire perimeter in the country, pulled live from NIFC, rendered in the ArcGIS SDK with scale-dependent icons. Click a fire to see name, acreage, containment status, and county population exposure. Then ask the AI analyst anything: filter by state, generate a situation report, or ask which fire is the highest priority. The map responds to plain language.